In recent years, using virtual mediums have become more popular and it seems to be a growing tendency to use them. Many virtual tools (e.g. web pages, apps,….) have made, mostly in order to make access to information easier for people and also save their time.
As it is of utmost importance to know about the needs and trends before introducing our app in MaryMD, we decided to have a limited study via an interview asking women if they prefer virtual or in-person visits.
This is the question we asked a group of women in some healthcare centers. As figure-1 shows, despite limited number of people in this interview, we tried to categorize the results ( mainly by age) to understand which group (or groups) prefer virtual visits or consultations and (if possible) why?
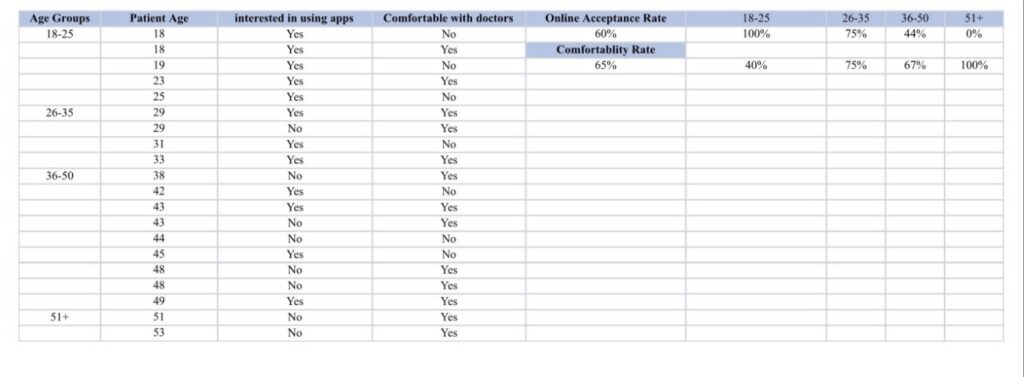
20 women were interviewed by asking them whether they are comfortable with in-person visits from doctors.
The following questions were asked to the participants:
1- Are you comfortable with in-person visits from doctors?
2- Are you interested in using virtual mediums ( i.e. internet, apps, online tools, etc.) for healthcare consultations or visits?
In either case the answer could be YES/NO
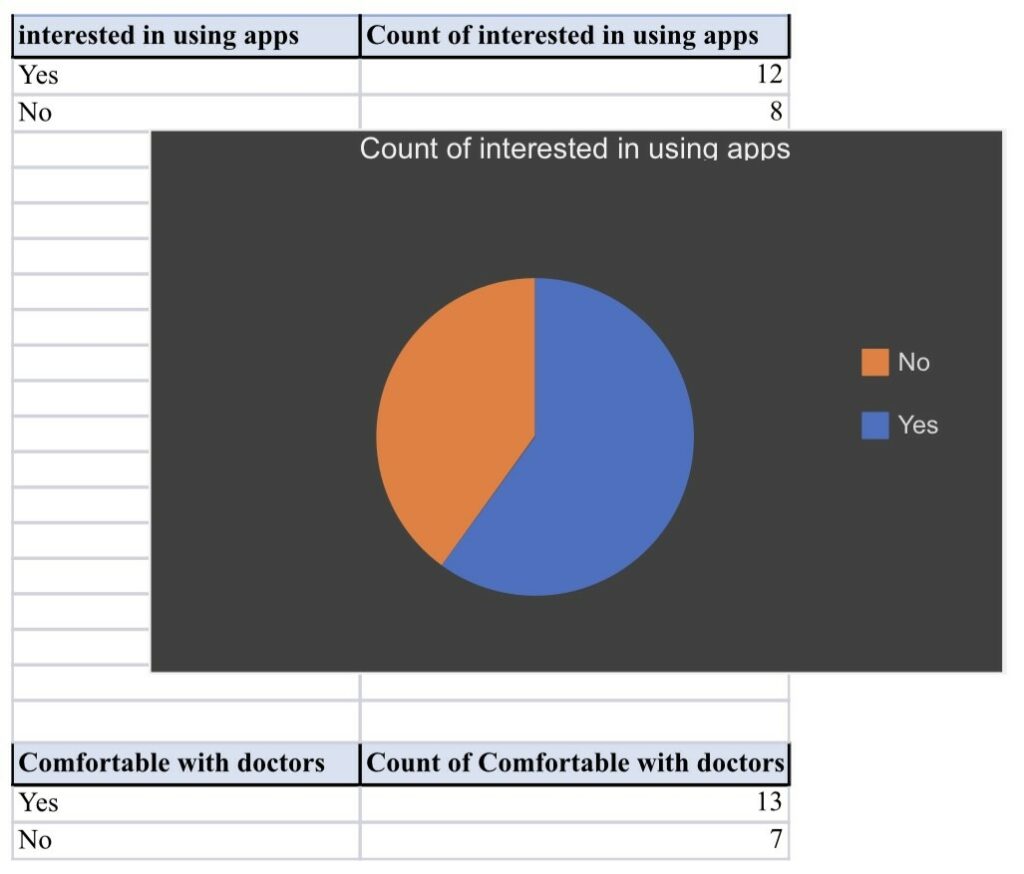
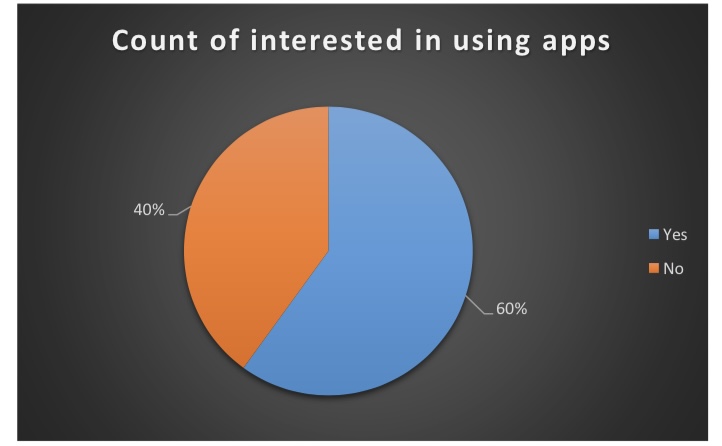
It can be seen that for each group (apps vs. docs) there is almost similar tendency (as we can see in figures 2 and 3) ;
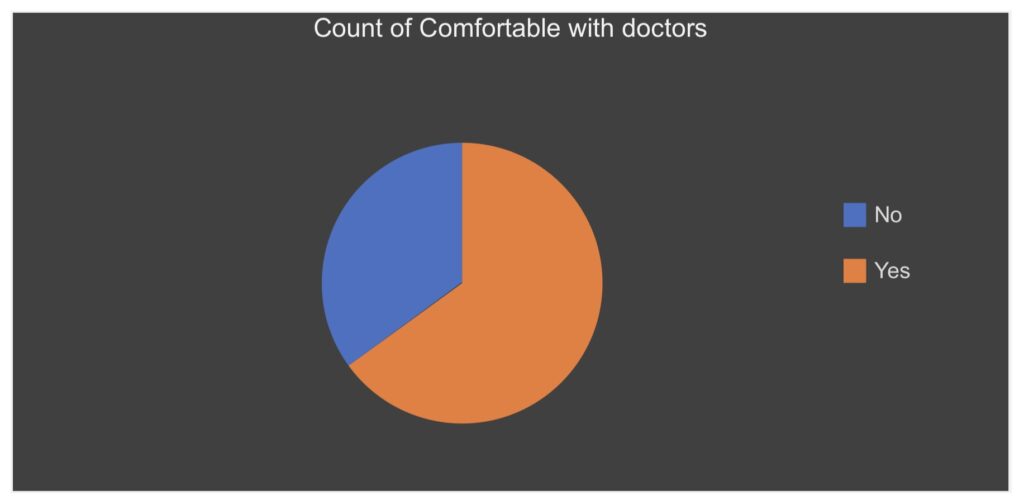
As we can see in figure-4 the number and percentage of women which are comfortable with doctors are roughly similar;
Although it seems from previous graphs that the acceptance rate in two groups (apps and doctors) are very near in our study, if we concentrate on details, focusing on results in age groups, we will get some valuable information about the tendency of each age group.
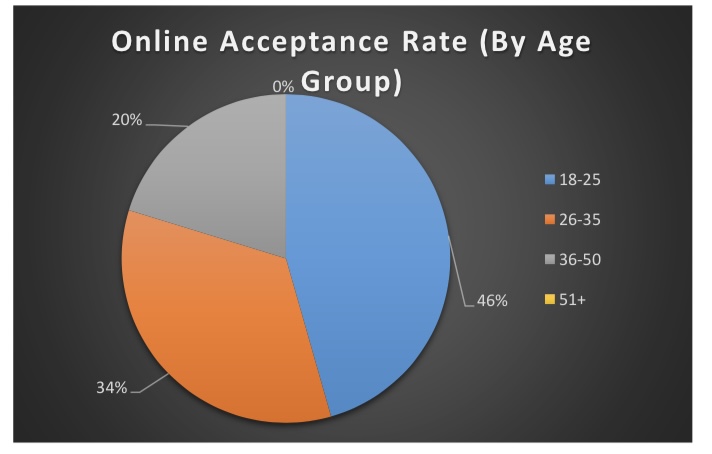
We can see clearly in figure-5 that younger women are more interested in using apps than having in- person visits.
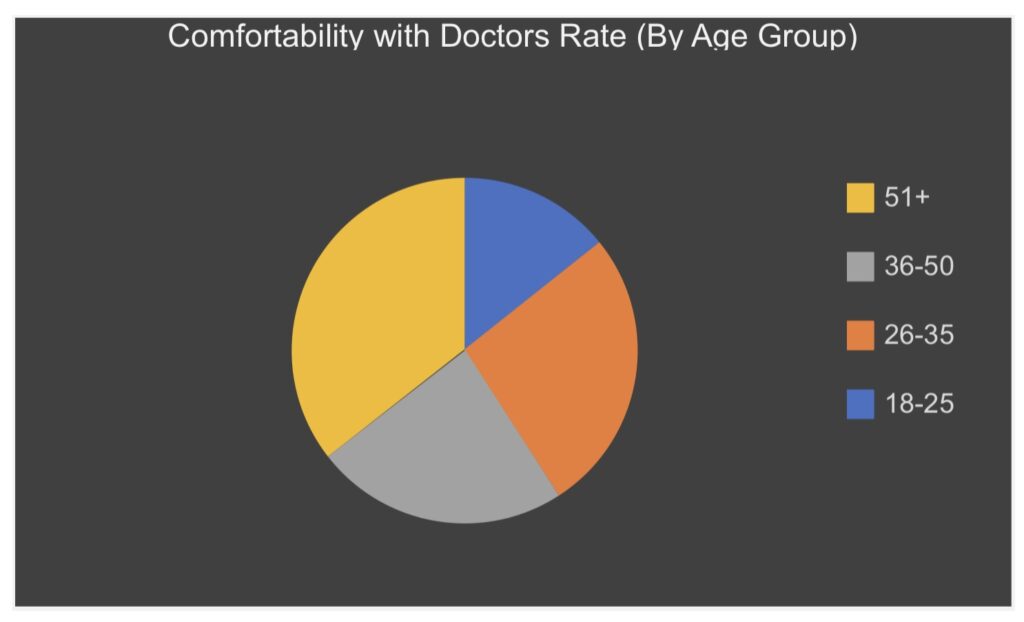
On the contrary, the older women are more comfortable with in-person visits as we see on figure-6 ;
Our customer interviews indicate that there is a tendency for the younger generation to use virtual tools.
Although the sample size of this study was too small to show the real population tendency, it seems that virtual tools are becoming more and more accepted overall. This seems to be the growing trend after the COVID-19 pandemic.
Future studies should be done in order to corroborate our findings.These studies should be redone with a much larger sample size in order to get an accurate representation of the population’s desires on the matter.

One Response
I wanted to thank you for this wonderful read!! I definitely enjoyed every bit of it. I have got you book-marked to check out new things you postÖ